


Against a backdrop of geopolitical and market volatility, emerging market equities have performed strongly again this year with the MSCI EM Index up 22% in absolute terms and 15% ahead of its developed market equivalent[1]. These gains have been fuelled by record earnings and rising expectations for further growth, with EPS currently expected to increase 55% in 2026, up from 18% at the start of 2026. This has, in turn, lifted profit margins and return on equity to cyclical highs.
The market leadership is increasingly narrow, however, and concentration risk is rising for investors. Just as the MAG 7 have done most of the heavy lifting in the US, a handful of megacap AI-powered companies have driven equity returns and earnings growth. In EM, it is Korea and Taiwan – boosted by the semiconductor and memory companies at the centre of the AI supply chain – that have led the way. Korean equities are up 109% this year and expected to contribute almost two-thirds of the MSCI EM index’s earnings growth in 2026[2]. For FTSE, where Korea is classified as a developed market, the EM index has delivered only half the return of the MSCI equivalent over the past twelve months.
The Korean rally is particularly thin. Roughly three-quarters of this year’s gains have come from just two stocks – Samsung Electronics and SK Hynix – which now represent over half of the country’s total market capitalisation. The first single-stock leveraged exchange-traded funds (ETFs) on these companies were launched in late May and within a week they were trading more than KRW 10 trillion (around USD 6.5 billion) a day. Taiwan is even more concentrated. TSMC – whose shares are up over 40% this year – accounts for over half of the country index alone. It is also the largest constituent of the MSCI EM index at 14.5%, nearly double the size of the next biggest (Samsung Electronics, 7.8%)[3].
As investors have embraced the AI-driven investment super-cycle, the tech sector weighting in the EM Index has overtaken the US equivalent and now exceeds 40% – higher than the dot.com bubble peak. This rise has come at the expense of more capital-intensive sectors like materials, energy and utilities which dominated the index only 20 years ago – a dramatic change driven by increasing middle classes and changing consumption patterns.

SKAGEN Kon-Tiki has evolved with the market and currently has around 60% of its portfolio invested in some of the world’s best companies in progressive sectors like IT, consumer discretionary and healthcare, as well as leading insurance companies in China, India and Poland that are benefiting from rising wealth, savings and investments.
Samsung Electronics and TSMC are the biggest contributors this year and although they remain in the top three holdings, we have taken advantage of share price strength to reduce both positions (the latter to also comply with regulatory requirements). The proceeds were used to scale up positions in Tencent Music and Ivanhoe Mines which entered the portfolio this year. Holdings in Prosus, Naspers, Axis Bank, Samsonite, JD.com and Suzano were also increased following relative share price softness.
Price-driven rebalancing
Selling into strength and buying into weakness have been key drivers of Kon-Tiki’s success over the years, enabling the portfolio to trade at lower valuations than the market without sacrificing quality. The fund’s top 35 holdings (90% of NAV) are currently priced at discounts of 27% (P/E) and 50% (P/B) to the index – also reflecting the fund’s tilt to cheaper small and mid-caps – and weighted upside of over 40% despite the market re-rating.
With earnings driving the recent rally, EM valuations generally are in line with long-term averages (P/E ~12x) and remain at a large discount to developed markets (P/E ~19x). Although differences between countries always exist, some, notably Taiwan and Korea are approaching levels not seen in the last 30 years[4]. Others, such as China and Brazil, are valued in line with long-term averages.
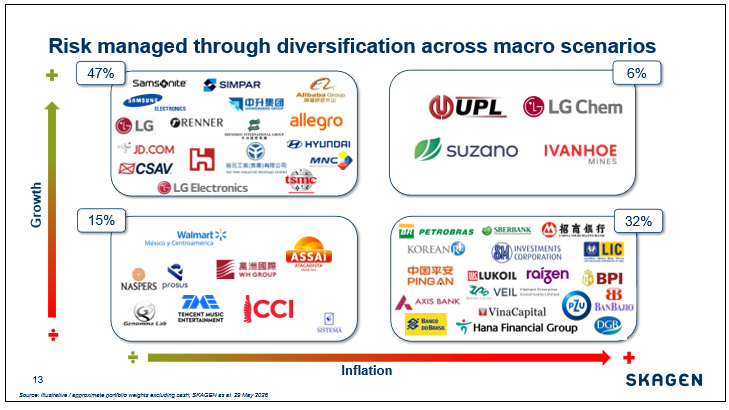
As well as being cheaper, Kon-Tiki’s portfolio is less concentrated than the tech-heavy index with its ~50 holdings spread across a broad range of countries and sectors. Its holdings are also diversified by economic driver with the portfolio positioned for different macro scenarios rather than geared to a dominant (AI) theme as the index increasingly appears to be.

Active value
Emerging markets remain an area of global equities where stock picking with a value focus works overtime. Data from Copley Fund Research shows that managers with the highest Active Share – a measure of how far a portfolio differs from the index – have delivered the most consistent returns over different periods, consistently outperforming over 3, 5 and 10-years.
The latest Bank of America Global Fund Manager Survey shows that investors are significantly overweight EM equities compared to both other asset classes and historic allocations. While the long-term investment case remains compelling, in an environment where index returns are increasingly concentrated and sentiment-driven, we believe that bottom-up stock selection and price-driven rebalancing are the most reliable path to sustained outperformance.
-----
[1] MSCI Emerging Markets (+21.8%) vs. MSCI World (+6.7%) as at 10 June 2026 in local currency.
[2] MSCI Korea Index in local currency as at 10 June 2026. EPS growth source: IBES, JP Morgan.
[3] Source: MSCI, as at 31 May 2026.
[4] Source: JP Morgan Guide to the Markets (P/B multiples).